Tuesday, October 28, 2014

Forecasting in Healthcare Industry – Is it unique ?


Forecasting demand in the Supply chain for Retail, Manufacturing, Automobile and other industries has been successful and established. Furthermore, the processes are unique but the forecasting is based on similar base factors. However, forecasting in supply chain for Healthcare industry is unique as it considers various other external factors.

In other industries, customers are segmented into large groups but in healthcare, mostly every patient case is unique to certain extent. This consideration makes the forecasting in this industry a little complex. Additionally, the forecasting depends on the demand by Caregivers too. Thus, the supply chain is not dependent only on patients but on two major demand pillars – patients and caregivers.

Healthcare industry has developed its own set of principles for forecasting the supply chain. The set of principles draws upon the concepts of retail demand forecasting models, but fully accounts for the unique nature of health care industry, in which a failure to meet the demands of consumers (patients and clinicians) can have dire consequences.

Today, with the advancement in the Healthcare industry, three factors make the forecasting attainable:

·         The abundance of untapped information already available in the hospital setting

·         A methodology of demand forecasting developed in other industries, but which can be adapted to health care

·       The maturation of some information technologies that enable an unprecedented level of integration of data from diverse sources[1]

Although hospital administrators often feel a lack of predictability, their potential for success in determining what they will need to stock their supply shelves may be substantially greater than in almost any other industry, at least for certain subgroups of their total annual purchases. At hospitals and clinics, a manager can walk-in and look at the schedules that tells the number of customers and potential product demand with relative accuracy for each day.

SKU and location-specific forecasting technology are used to synchronize surgeon preference information, and predict demand based on the hospitals scheduling, patient demographics, and even seasonal demands.  This strategy provides benefits of reduced inventory levels (bypass the problem of expiry), lower costs for case preparation, and improved fill rates and service levels. In addition, hospitals experience increases in clinical satisfaction, productivity, and patient safety as well.

Because the risks associated with health care are severe and extreme as compared to other industries, the quality of demand for forecasting must be spotless. The process must:

·         Project demand by location and SKU, and address long-term and short-term
needs (considering expiration and advancement of drug)

·         Support the hospitals budgeting and planning process to account for introduction
and expansion of medical/surgical programs; 

·         Address the importance of the critical lead times that are inherent and
essential in the health care environment.[1]

Questions:

Why forecasting in Supply chain for healthcare industry unique and different from any other industry?
How can risks be mitigated in forecasting in the healthcare industry? Is it even possible? If not, what else can be done to minimize the risk?
What are some additional methods the healthcare industry could use to predict and forecast? Can it benchmark predictive models from any other industry? If yes, what industries can they be?


[1] http://mthink.com/article/effective-demand-forecasting-health-care-supply-chain/

http://www.mckinsey.com/insights/health_systems_and_services/strengthening_health_cares_supply_chain_a_five_step_plan

An Excel Implementation of Time Series Forecasting


Forecasting the trend of demand is an important part in supply chain management and planning future marketing strategies. The accuracy of the forecast depends on the precise quantification of past statistics of consumer behavior.

Univariate forecasting method is an effective way of forecasting, based on the belief that any time series of data can be broken down into core components such as season, trend and errors. Once the parameters are estimated, it can be used to extrapolate historical sales behavior over subsequent time periods.

A sample 3-period moving average forecast of demand:


Suppose a company wants to use 3-period moving average to predict VCR demands. As the excel implementation indicates, forecasts for period 29 and up substitute the previous forecasts for missing data because the forecast can not use data we haven’t seen yet.

Figure 1: An excel implementation of 3-period moving average forecast of demand

We can change the window size and see how it affects forecasts.


Figure 2: Moving average result using different windows

As the graph shows, longer periods use more of the data. The forecast is not affected by a single outlier data point, however, longer periods also mean that old data might not reflect the present.

We can also try a recursive way to modeling, which means our next prediction is a function of the previous prediction. Here is a sample of exponential smoothing.

Alpha is a parameter bounded between 0 and 1, chose by minimizing RMSE of the model.


Figure 3: Using Solver to build exponential smoothing model

After some configuration of the Excel plugin “Solver”, we can get the forecasting using exponential smoothing model. Different from a moving average, the data is never thrown away completely.

A question for readers: What does the value of alpha indicates? Under what circumstances should we use small alpha, median alpha or large alpha?


Reference:

http://www.marketscienceconsulting.com/services/forecasting-and-simulation/

Monday, October 27, 2014

Forecasting TV Pickups in Britain


The British love their tea.  They also love watching TV.  When these two factors come together an interesting and unique phenomena known as the TV Pickup occurs.  During commercial breaks, half times, at the end of shows, and between shows millions of households put the kettle on to heat water for their tea.  This draws vast reserves of power (multiple giga-watts worth) in less than five minutes, resulting in a possible overload of the power grid.  The challenge is to effectively forecast the massive surge in energy usage caused by the TV Pickup.

In some ways forecasting for this massive increase in demand is simple.  The timing, at least, is fairly easy to follow.  The two examples used, EastEnders (a B.B.C. sitcom) and large soccer matches, both have predictable stoppage points.  The end of EastEnders is set ahead of time, although as seen in the video they sometimes run slightly over which requires quick adjustments to the timing of the TV Pickup, while soccer matches have half-time at 45 minutes and the game finishes at 90 minutes.  Timing the TV Pickups for soccer is a little more complicated due to the addition of stoppage time (games on-average run 3 minutes over, though stoppage time can be as short as 30 seconds and as long as 8 minutes) as well as extra time/shootouts of the game is tied at the end and being played in a tournament setting.


With a bit of experience for soccer it is easy to tell how long stoppage time will be or if the game is headed into extra time, but the biggest challenge comes in forecasting viewing demand and the number of kettles that will be put on.  Most episodes of EastEnders average 7 million viewers, with some getting as high as 9 million.  However in 1986 when Den Watts served Angie her divorce papers (disclaimer: I have no idea who these characters are or what their story is) the show attracted 30 million viewers.   The challenge then becomes predicting the popularity of specific episodes, which means following the plot-line and attempting to forecast when an upcoming episode will be more popular.

For soccer it can be even harder to tell which matches will be the most popular.  To date the England vs West Germany semi-final match in 1990 was the most popular, with the equivalent of 1.12 million kettles being put on at the end of the game (the end of extra time to be specific).  The second most popular was the quarter-final matchup of England v Brazil in 2002, when the equivalent of 1.03 million kettles were put on at half-time.  To further complicate things, the equivalent of 840,000 kettles were put on at half-time of the extra time in the 1998 round of 16 matchup between England and Nigeria.  


Half-time, end of extra-time, half-time of extra time, it can be difficult to predict at which breakpoint people will want their cuppa.  Predicting overall viewership can also be difficult, as it is hard to tell which games will be the most popular.  To do this they have begun surveying soccer fans to determine which games they think will be most popular and which games they will watch.

Ultimately the task of forecasting TV Pickups is a difficult one, where power grid operators must rely on a blend of historical data and intuition to accurately project power usage from kettles and respond accordingly.


What are some additional methods the utility companies could use to predict and forecast which TV programs will be the most popular?

While the TV Pickup is unique to Britain (due to their love of tea and kettles), are there any similar phenomena that occur in the United States?


http://www.telegraph.co.uk/sport/football/world-cup/10862802/Will-World-Cup-2014-cause-the-lights-to-go-out.html
http://www.bbc.co.uk/britainfromabove/stories/people/teatimebritain.shtml
http://en.wikipedia.org/wiki/EastEnders

Business Forecasting (Target's Credit Card Breach)

Forecasting in business is one necessity that can help to either make or break a company. While forecasting is extremely necessary to predict inventory and future plans, it is often extremely difficult to do. There are many events companies fail to observe when forecasting, and there are also unexpected events that could affect the projected forecast, as we have observed with the tsunami in Japan.

While some businesses decide to ignore or put little to no effort into forecasting, it is one of the most useful tools in successful companies. Every company has a plan to be operating in the future, so one would begin to think why some companies and managers fail to complete this process. This is an important procedure to predict future inventory, outcomes, and possible worst and best-case scenarios.

With this in mind, we can look into a successful company with an unexpected event that altered their planned forecast of financials and sales. Target has been a successful retail company for many years. However, within the year, Target has suffered many problems with customer's credit card information being hacked from their system. In an article titled, "Target gives more bad news as it cuts profit outlook, discloses more theft details" by Andria Cheng, the expected forecast is explained. Before the credit card breach, Target sales were better than expected and were remaining that way. However, with this unexpected event, sales began to drop and projected forecasts began to sway. Now, with this new information, Target has begun to look into a new projected forecast with these estimated damages taken into account. Target began to cut future outlooks and re-estimate holiday sales.

The graph below shows the decline in Target's stock and sales from the first orange dot to the second orange dot. The graph then goes on to show an expected trend for Target's future sales, with a very unstable prediction of ups and downs.
(http://blogs.marketwatch.com/behindthestorefront/2014/01/10/target-gives-more-bad-news-as-it-cuts-profit-outlook-discloses-more-theft-details/)

 This article ties into our discussion of forecasting by showing how even top companies can suffer unexpected events and change their predicted numbers and plans. However, although Target may not have accounted for this event in their future, they may have taken into account some unexpected event and the damage it may cause. With this in mind, Target has taken the steps to readjust their forecast and plans for the remaining future.

Question:
What steps should Target initially take to re-estimate their numbers? Would Target be best by compiling data on other related businesses? Would intuition/judgement be a good decision to estimate the future sales for Target?

Website:
Cheng, Andria. "Target gives more bad news as it cuts profit outlook, discloses more theft details". Market Watch: The Wall Street Journal. 10, Jan. 2014. 27, Oct. 2014. http://blogs.marketwatch.com/behindthestorefront/2014/01/10/target-gives-more-bad-news-as-it-cuts-profit-outlook-discloses-more-theft-details/

Forecasting Fracking Fields: A Supply Chain of Chemicals

Hydraulic fracturing or “fracking” is a topic for hot debate in regards to safety and sound environmentalism. Nevertheless, the number of US fracking wells has seen a steady increase since 2002, as can be seen in Figure 1 [1].

Figure 1.
Figure 1 also shows the corresponding increase in “silica proppant” as the number of horizontal fracking wells increase. Silica proppant is a chemical injected at each wellhead to extract previously inaccessible oil and natural gas from the ground.

Therefore, the success of fracking wells largely depends on the accessibility and availability of silica proppant. Figure 2 shows a typical example of how silica proppant travels from a Minnesota mine to a Wyoming fracking site [2].
Figure 2.
Furthermore, ensuring each wellhead has an adequate amount of silica proppant is made more difficult due to the fact that this chemical mixture has a timed shelf life of when it is most effective. Otherwise, large holding tanks could be built at each wellhead and drawn from as needed. Due to the shelf life of the silica proppant, advanced forecasting can be used to ensure enough chemical mixture reaches each wellhead to cater to the demand for oil and natural gas. Some fracking drillers are taking advantage of the industrial internet of things (IIoT) and using sensors on holding tanks located at each wellhead to know exactly how much silica proppant is needed [3]. To improve forecasting even further, shipments of silica proppant destined for certain wellheads can be tracked via GPS to know precisely how much chemical will reach each well at what time. If this information is shared with the company supplying the silica proppant then the supplier can better prepare for future demand and scale up or cut back production as needed.
To be as successful as possible in the fracking industry requires up to date information within the supply chain. Forecasting can be introduced to increase success. 


[1 & 2] Mawet, Pierre J., Alex C. Fleming, and John H. Nichols. Eight Leading Practices for the Proppant Supply Chain. Rep. Accenture. < http://www.accenture.com/sitecollectiondocuments/pdf/accenture-eight-leading-practices-proppant-supply-chain.pdf/>.
[3] "Fracking And Chemicals Used In Drilling: A Supply Chain In Need Of Improvement." Forbes. Forbes Magazine. Web. 27 Oct. 2014. <http://www.forbes.com/sites/stevebanker/2014/09/26/fracking-and-the-chemicals-used-in-drilling-a-supply-chain-in-need-of-improvement/>.

Sunday, October 26, 2014

Holiday Forecasting at UPS & FedEx


As the holiday season approaches, organizations like UPS and FedEx are scrambling to prepare for their peak season.  I found two very interesting articles from last holiday season that explain how these companies forecast and prepare for the season and how they made some serious forecasting errors last year.  Since this week’s classes will focus on forecasting, I thought that these articles would add to our discussion and understanding of the topic.

The first article, “UPS's Holiday Shipping Master: They Call Him Mr. Peak,” described UPS’s preparation for their peak season.   Interestingly, UPS forecasted that it would carry 3.6 million boxes last December 23rd alone.  Scott Abell, who focuses on one to three day deliveries at UPS, begins to plan for UPS’s holiday rush in January. The article discusses the forecasting process, which involves numerous revisions throughout the year that continue all the way into December.  Abell mentions a number of things that impact forecasting, which include: Internet shopping (that often happens last minute), the number of shopping days between Thanksgiving and Christmas, winter storms (especially ice which causes problems for trucks and increases online shopping), and demand from 25 or more retailers.  Accurate forecasting is essential because it dictates how many extra employees the company will hire and what equipment and supplies the company will need to purchase.  However, forecasting is not always accurate, so UPS has a contingency team on staff to deal with issues that arise from inaccurate forecasts.

Below is a graph that shows peak season shipping data for both UPS and FedEx.  This type of data indicates holiday trends and would be a part of UPS’s forecast.


The second article, “UPS Holiday Season Fiasco: A Failure of Strategic Planning,” explained that both UPS and FedEx made errors when forecasting holiday demand last year, and this caused the companies to fail to meet some of their delivery promises.  The article explains that many customers did not receive their holiday packages before December 25th, and the author attributes this to planning failures that relate to automated sorting systems as opposed to manual facilities.  In automated systems, once demand is underestimated, it is often too late to make any substantial corrections, which would require leasing planes and installing additional sorting equipment.  The author brings up a dilemma that UPS and FedEx must deal with – how can they deal with the holiday rush without destroying their budgets?  The rush requires additional expenditures on equipment and employees, and those costs need to be made up through shipping prices.  However, if either company raises shipping prices, they risk losing business to the other company.

I thought these articles were particularly interesting because they came out just two weeks apart.  The first article almost praised UPS for their forecasting methods, and the second explained that their forecasts were seriously flawed.  What I take away from this is that forecasting is complex and extremely hard to get right. 

Questions:

1.  Given the costs associated with overestimating customer demand, does it make sense to make conservative estimates and risk upsetting customers?

2.  Can you think of other factors that would affect forecasting for the peak season (for UPS and FedEx)?

3.  Do you think customers would be upset if the shipping companies raised prices during the peak season to cover their extra costs?  Would it be better to raise prices throughout the year to cover the costs?  How do you think price increases would affect the shipping industry during the peak season?

Sources:


Saturday, October 25, 2014

Supply Chain Management Forecasting: Walmart

Forecasting in a supply chain is the framework for all strategic and planning decisions. Accurate forecasting successfully determines how much inventory a company must keep at various points along its supply chain, allowing for the ability to shape and scale resources. Furthermore, forecasting is of the utmost importance for supply chain managers, as reliable and accurate forecasts can contribute to achieve the most challenging objective: matching demand and supply.

Uncertainty in predicating future demand may thwart industry supply chain management, manifesting unreliable sales. This issue forms the basis of inventory management and planning systems. Industry leaders expend considerable time and effort to eliminate problems and introduce new processes and systems to enhance accuracy and efficiency involved in entering, planning, and fulfilling orders.

Walmart supply chain operations, for instance, focuses on demand planning, forecasting, and inventory management. Such forecasts provide customer demand estimates for a particular product during a specified period of time (based on historical data, upcoming sales and promotional drivers, and competition trends). Parenthetically, demand planning is critical to effective inventory management (see figure below for the multiple forms of forecast movement).


As an example, Walmart was first to implement a companywide Universal Product Code (UPC), in which store level information was immediately collected to analyze and forecast supplier demands. Within the supply chain, manufacturers and suppliers synchronize their demand projections under a Collaborative Planning, Forecasting and Replenishment scheme (CPFR). In this scheme, Walmart worked with key suppliers (on a real-time basis, through Internet utilization) to collectively determine demand forecast. Years later, following UPC bar codes, Walmart implemented Radio Frequency Identification (RFID) technology to replace it’s original bar-code innovation. The company believed this replacement would reduce its supply chain management costs and enhance efficiency; for example, this technology assisted in reducing instances of stock-outs at the local stores.

Was this innovation the key to Walmart’s highly successful supply chain management? What other methods may help to reduce inventory costs while simultaneously enhancing produce availability across the supply chain? Regardless, Walmart’s supply chain and inventory operations provides valuable learning points that businesses may take and apply to their own operations.

_________________________________________________________________________________
Sources:
1) http://www.ascinstitute.com/library/whitepapers/Forecasting,%20Demand%20Management,%20and%20Capacity%20Planning.pdf

2) http://www.arkansasbusiness.com/article/85508/wal-mart-used-technology-to-become-supply-chain-leader?page=all

3) http://blog.tradegecko.com/incredibly-successful-supply-chain-management-walmart/ 

Sunday, October 19, 2014

WonkaVision - Much like 3D printing!

As Prof. Z introduced us to 3D printing, I couldn't help but be taken back to childhood.

Grade 4, Library room. The librarian is reading to us Roald Dahl's Charlie and the Chocolate Factory. One of the rooms within the gigantic factory of Mr. Willy Wonka, the Television Room, houses his latest invention, WonkaVision. A giant chocolate bar, when placed in the contraption, is transmitted through the air in microscopic bits, only to appear in a television. This bar can be taken from the TV and even be eaten!

I think this comes really close to the idea of 3D printing.

3D printing or additive manufacturing transforms digital files to an actual solid three dimensional object by laying down successive layers of material until the entire object is created. This process allows customization of products, alleviates complexity involved in the traditional manufacturing process, is cost-, time-, and labor-efficient, and sustainable, too!

Roald Dahl was surely way ahead of his time! When he penned down the story in 1964, little did he know about 3D printing and how it would prove beneficial in the future.


Coming back to the story, Mike Teavee lets sloth get to him. His obsession with television makes him amazed at this new discovery and he attempts to send himself through television resulting in him being shrunk down to be no more than an inch high. Talk about invention, innovation and a moral for kids - all bundled in one book! :)


Inventory Management at Walmart

In class, we discussed how inventory management - good or bad - can significantly impact a company's supply chain. Through the Scientific Glass, Inc. case study, we saw that having too much inventory can decrease the liquidity of assets and affect how quickly a company can adapt to changes in consumer demand. Most importantly, however, having the improper level of inventory can impact profitability, which is really all companies care about at the end of the day.

In scouring the Internet for something that applies to this topic, I found an article discussing Walmart's inventory struggles that occurred last fall. It claims that Walmart's inventory levels increased partially because they did not predict sales accurately (going back to our lecture on forecasting). Further in the commentary, though, the author begins talking about seasonal items - decorations for Halloween and Christmas, in particular - and their impact on Walmart's inventory. According to Walmart CEO Bill Simon, the increase in inventory is due to "timing shifts in the receipt of merchandise for [...] the upcoming holiday season." But the big question remains: why change it?

Employees interviewed for this article say that usually, the bulk of Christmas items arrive in shipments a couple weeks before Black Friday, in line with the "just-in-time" delivery system we learned about in class. However, last year, Walmart began sending mass amounts of holiday products way before then, which impacted how Walmart prioritized its space on the floor. The company had to heavily discount certain items (the article mentions sweatpants) to make room for prematurely delivered holiday merchandise. The organization of products in stores is haphazard, since Halloween jack-o-lanterns and Christmas trees sit next to each other in the seasonal items section. And since the back rooms of most Walmart stores are already stocked heavily with day-to-day merchandise to meet consumer demand, the Christmas products that arrive early are forced onto the floor out of necessity.

Does Walmart honestly think that consumers are ready to buy Christmas items before Halloween? Why drastically increase inventory levels at stores all around the country just for holiday products? Honestly, it does't make much sense to me! What do you think?

Here's the article: http://www.bloomberg.com/news/2013-09-25/wal-mart-cutting-orders-as-unsold-merchandise-piles-up.html


Friday, October 10, 2014

Exception in Supply Chain Management – ZARA(INDITEX)

Generally, when we speak of supply chain, it always involves the division of various companies in assorted departments at different stages of supply chain. Under certain circumstances, like IKEA, consumers even perform in the supply chain. In addition, the defect of any link would have a ripple effect on the whole supply chain.

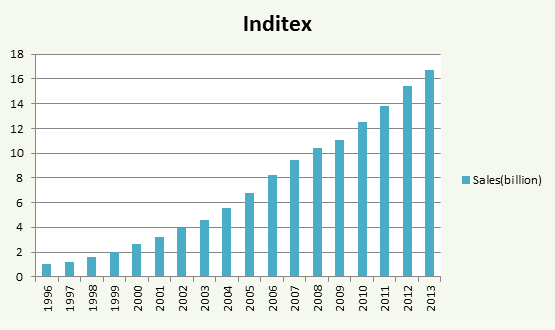
However, ZARA survives and thrives in the competitive market through a unique pattern of supply chain management. From 1996 to 2013, Inditex's sales, of which about 80% is from Zara, has increased from 1 billion euros to 16.7 billion euros. And between 2000 and 2006, Inditex achieved sales growth of 30% a year, a net margin of 11%, and a return on average equity of 29%—well ahead of Gap, H&M, or Mango.[1]
Through a responsive supply chain, it only takes ZARA 15 days to manufacture from scratch, which is unprecedented in the fashion industry. Since designers usually spend several months in designing clothing of the next quarter, ZARA’s sales profit could be higher among rivals. Contrary to competitors in apparel industry who are scrambling to adopt outsourcing strategy, Zara keeps almost half of its production to himself. And rather than maximize production capacity like peers, ZARA deliberately keeps some extra capacity; 
 
To unravel the secrets of ZARA’s supply chain management, there are three principles we should pay attention to.

1Establish a closed-loop communication
This "fast" system relies heavily on continuous exchange of information between various parts of the supply chain. Weekly computer communication or telephone conversations prompt each store transfer information in a timely manner to La Coruna, the headquarters of ZARA(INDITEX).
Once the team has selected a prototype for production, the designers will adjust the color and materials via computers. The continuous flow of real-time data alleviates the Bullwhip Effect, avoiding the malignant effect of excessive production. On the other side, small-lot production prompts customers to patronize Zara shops more frequently, so reduce the need for advertising.

2) Keep the whole supply chain in a single rhythm
Zara takes complete control over the supply chain. It is ZARA who is responsible for the design and distribution of all their products, enjoys a low proportion of outsourcing, and possess almost all of the stores.
The control over the supply chain enables ZARA to set speed for products and information, so that the entire supply chain could operate in a fast and predictable rhythm. Take retail stores for instance, store managers order twice a week. Store managers could know exactly when will the goods arrive after the goods have been shipped. After the trucks arrive at the shops, fast-paced still maintain. Since the clothes have already been hung on the racks, you can put them into the stores directly.

3) Use capital to improve the flexibility of supply chain
Zara has invested a lot in production and distribution to improve the response speed of the supply chain so as to satisfy needs in the market.  ZARA always produces complex products while leaves the simple ones outsourced.
On the one hand, many ZARA’s factories only arrange one shift, on the other hand, all the products are concentrated in La Coruna by central distribution center processing. Since plant capacity and processing capacity of the distribution center are all maintained at a low level, it guarantees a quicker response in the season or when sudden demand comes. Meanwhile, thanks to the fast response of plants and distribution center, the working capital is significantly reduced. Under that circumstance, the liberated capital could offset the investment in extra production and processing.

Even though we know that ZARA operates quite well, but does this works for all companies?

The application of B2B Exchange in Alibaba

B2B describes commerce transactions between businesses, such as between a manufacturer and a wholesaler, or between a wholesaler and a retailer[1]. As the largest B2B platform in China, Alibaba performs as an information infomediary in the supply chain, integrating large amounts of information on both buyers’ and sellers’ sides, involving different industries from electronics, machinery, clothing to finance and so forth.

Specifically speaking, the B2B exchange of Alibaba operates in the following ways:  

First and foremost, the core concept of Alibaba is information flow, that is to aggregate voluminous market information in a single platform to benefit businesses.

Secondly, for the convenience of companies in different countries, Alibaba runs its website by adopting local languages. The convenience and affinity of the website somehow smoothly integrates markets among nations and correspondingly provides an integrated platform for international trade.

Apart from that, in the initial stage, Alibaba attracts companies in virtue of lowering the threshold of entry and offering free membership. The result is remarkable -- companies join together and contribute to an active market via the Internet, which consequently generates infinite opportunities for members meanwhile.

At the end of August 2010, membership of Alibaba has arrived at 53.4 million from 202 countries and regions, and daily registration goes beyond 1500. Affected by free membership, the majority of its membership is SMEs. And there are about 45 million page views per month, 3000 new trading information per day and more than 300,000 inquiries per month. 
Distribution of Overseas Members
Last but not the least, through value-added services, Alibaba provides an exceptional marketing service to its members, which not only creates service function on the online trading market, but also makes profit for Alibaba. The profit gained mainly comes from China suppliers (they offer Chinese businesses special inquiries for international buyers in various countries), designing of companies’ websites, online marketing programs and Trustpass.
From the above discussion about Alibaba’s B2B Exchange, we can see that B2B Exchanges create value in at least four ways,
1)  expand everyone’s market reach, so it is more approachable for buyers to find suppliers with the right parts and prices;
2)  generate lower prices for buyers, and thusly buyers can reach more suppliers or the most efficient supplier and benefit from increased price competition and access to excess inventory stocks;
3)  cut the cost of the buyer’s operations;
4)  identify industry best practices.
In conclusion, B2B serves as the “glue” to create a coordinated supply chain and is of great significance in today’s supply chain. However, do you think B2B will wane with the rise of B2C and C2C?

[1] http://en.wikipedia.org/wiki/Business-to-business